
You Probably Can't Diagnose Autism Spectrum Disorder From A Urine Test
Picky eaters, pokey numbers, and powerful confusion


(JH note: I was talking to Gideon M-K: Health Nerd about this study, and rather than write two half-versions of the below, the collaboration feature lets us write the whole thing once. How nifty. But as this won’t naturally cross-post — which really should be a feature! — you should start by going to Gid’s page linked above and shower him with gifts first.)
THE PAPER
Elevated microbially-derived metabolites in autism: a possible diagnostic screening test for a distinct ASD phenotype
Published in Nature Molecular Psychiatry, last week.
Abstract
Many studies have confirmed that a subset of children with autism spectrum disorder (ASD) have unusually high urinary concentrations of microbially-derived metabolites (MDMs) such as p-cresol sulfate and indoxyl sulfate. We hypothesized that these MDMs may affect neurodevelopment through the gut-brain axis and that a sub-phenotype characterized by gut dysbiosis may be present in most ASD individuals. This multi-site study involved measuring the concentrations of many MDMs in the urine of 52 children with ASD and 47 healthy, typically developing (TD) children, aged 2 to 11 years. The measurements were conducted first with semiquantitative Liquid Chromatography and Mass Spectrometry (LC-MS), followed by targeted quantitative LC-MS. The ASD group had significantly higher concentrations of many MDMs compared to the TD group. The MDMs included phenylalanine-derived, tryptophan-derived, and yeast-derived MDMs. Almost all children with ASD had one or more MDMs at concentrations above any TD child, and sometimes 100–1000× higher. The children with ASD had an average of 3 MDMs at levels above any TD child, compared to zero (by definition) for the TD children. Classification using one or more elevated MDM yielded a sensitivity of 90% and a specificity of 100%. This MDM SystemTM is a promising non-invasive method for diagnostic screening for ASD in children ages 2 to 11 years. These data also suggest approximately 90% of children with ASD have a distinct phenotype of ASD, which we propose naming ASD associated with Microbially-Derived Metabolites (ASD-MDM), defined by objective, quantitative laboratory measurements of these metabolites in urine.
Translation: we think that the bacteria in the guts of children with ASD produce specific chemicals (metabolites) that (a) might affect brain development and also (b) might help us diagnose ASD earlier or more easily.
Either of these would be a great medical (and commercial) success.
The implications are potentially massive. The authors are implying that they’ve discovered the cause or maybe a strong contributor to 90% of ASD diagnoses.
THE PROBLEMS
We are quite concerned about this paper, and we think you should be too.
Diet
The most obvious concern is very, very straightforward: food.
It is a well-documented clinical reality that children with ASD are much more likely to be food selective. This includes neophobia (fear of new foods) and strong preferences for "low sensory" foods (e.g., highly processed carbohydrates like white bread, crackers, and chicken nuggets), uniform color, certain temperature, etc.
There are individual differences, but a baseline ASD cohort diet is fundamentally different from neurotypical — ASD children are three to five times more likely to be picky eaters. This is a serious, obvious, large, well-observed difference. It progressed long ago from common knowledge to received wisdom. It’s a topic that has its own entire body of literature.
“This paper provides a comprehensive narrative review of the empirical literature over the last 25 years on food selectivity and nutritional adequacy in children with ASDs.”
(Note: this review of 25 years of literature is itself 15 years old.)
In other words: any ‘diagnostic test for ASD’ is potentially not functionally distinguishable from ‘urine test for a picky eater’. The conceptual flow of:
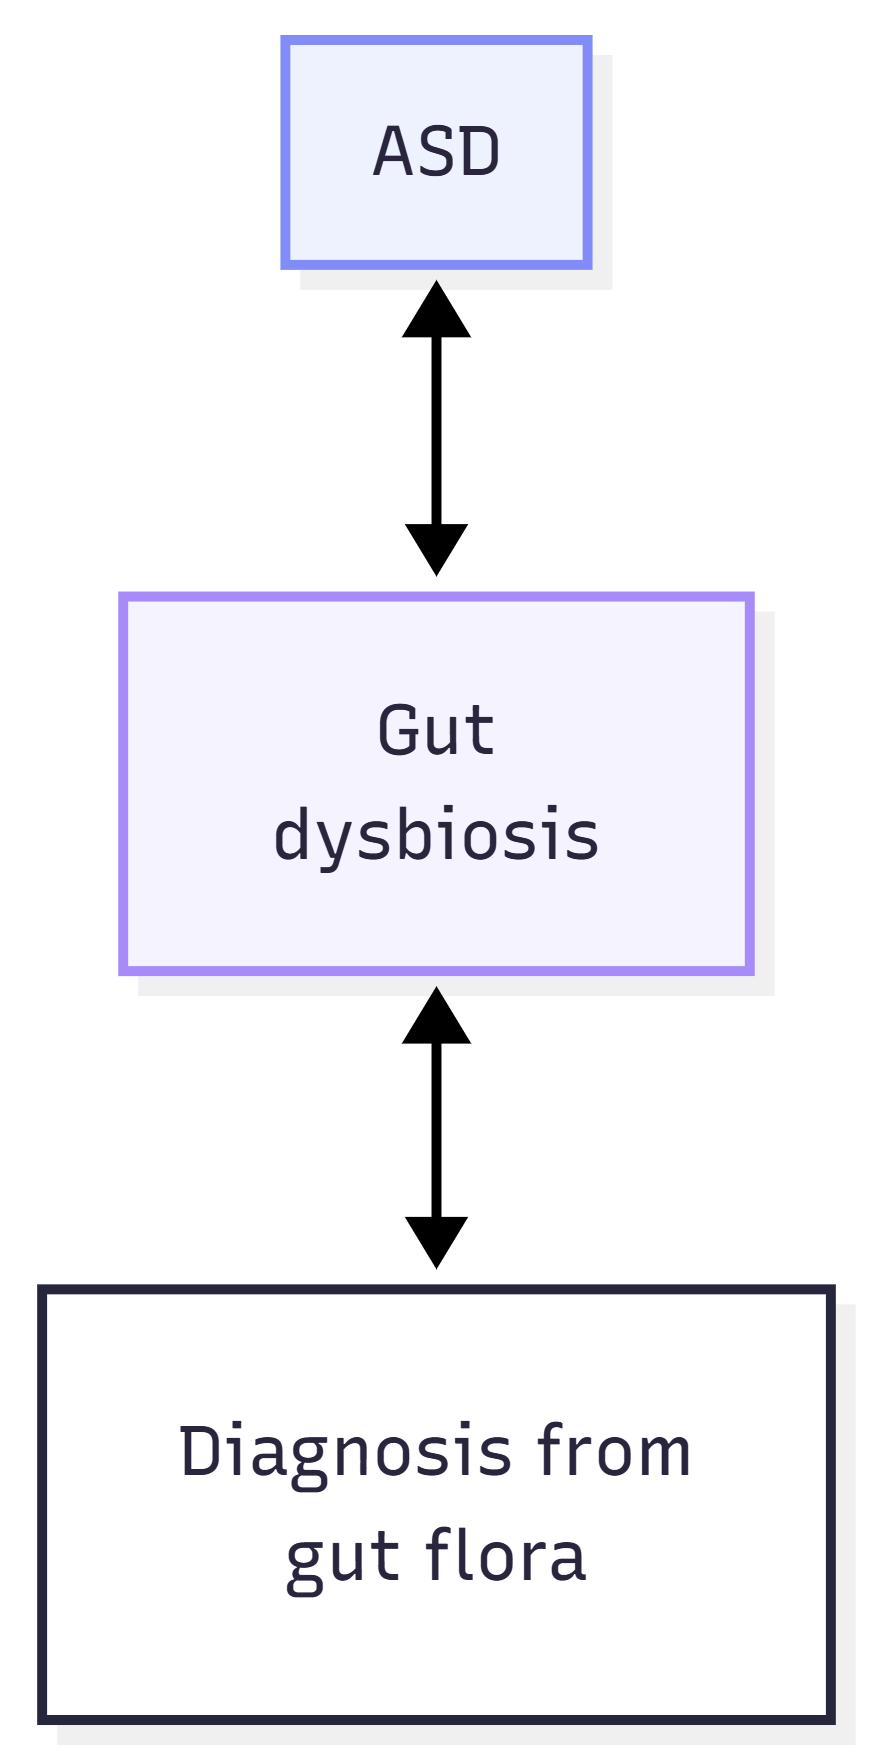
… is very, very likely to be too simplistic, because we know at an absolute minimum that the situation is more akin to:
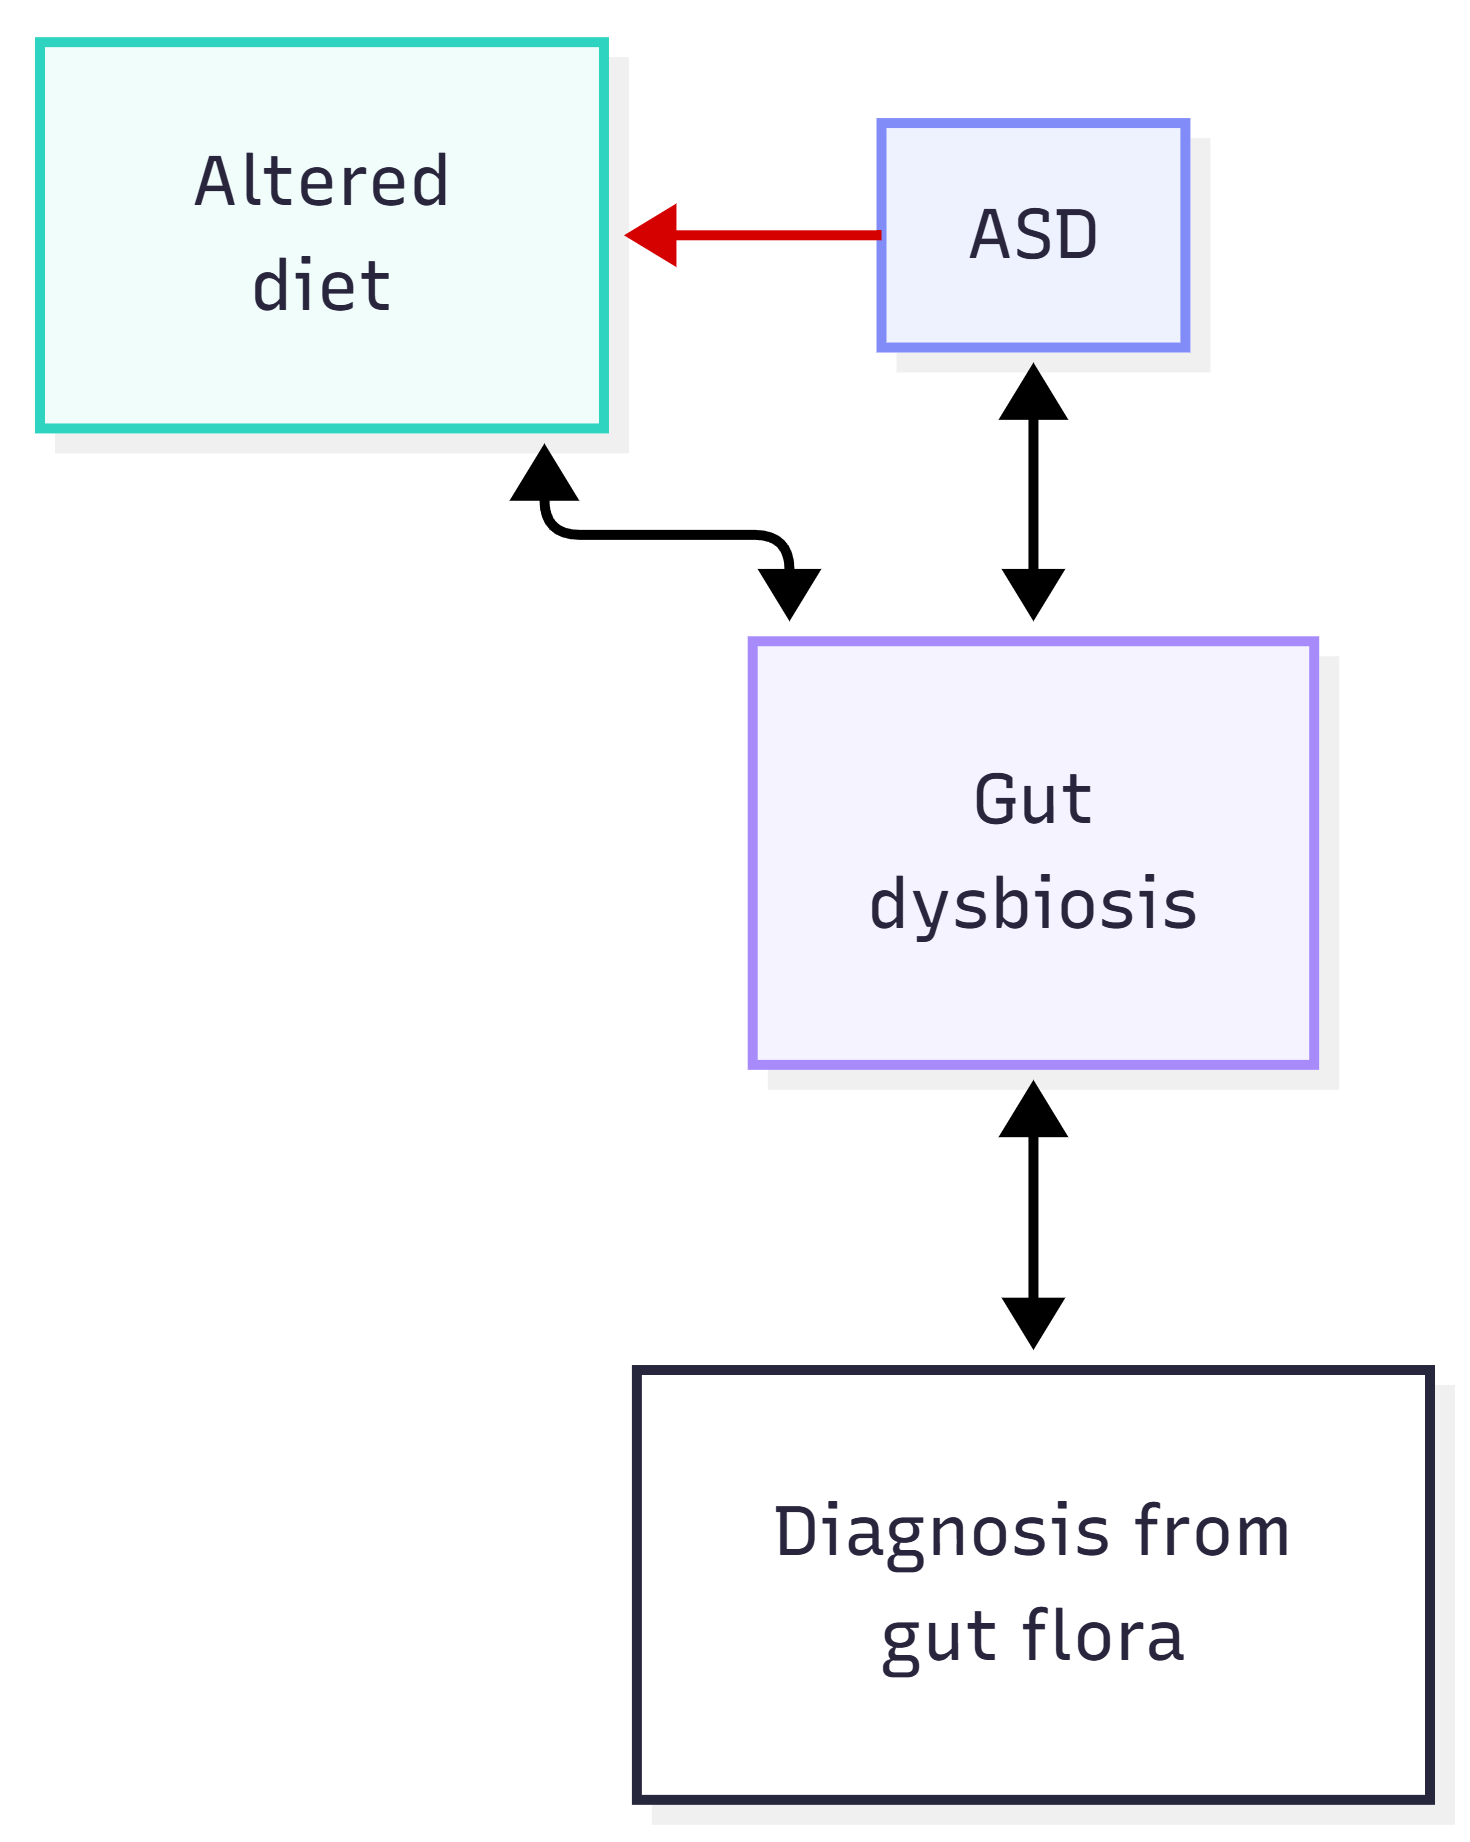
That first arrow is red because we are extremely confident about the direction of causality. So what did the paper do about it?
“Data on diet and medication use was not collected.” (p.8)
Nothing.
This is a sufficient level of oversight that it is frankly confusing. Many of the metabolites we’re about to discuss aren’t just metabolic byproducts, they’re also in the food.
(Benzoic acid, for instance, is a common used food preservative that’s metabolized to and excreted as hippuric acid — both are measured here, and without any care to ‘how much soda did this child drink?’)
Time of symptoms appearing
There’s also the large matter of temporality. For the test in this paper to be useful, or really for us to care about it at all, the gut dysbiosis has to happen before the other symptoms of autism.
Think about it for a second. We don’t create diagnostic tests for the enduring fun of collecting urine. We create them so that we can use them to diagnose and even potentially treat people.
The authors are not shy about this. They say:
“microbial metabolites found elevated in ASD may contribute to neurological alterations such as sensory dysregulation, mood instability, and impaired language development.” (p.8)
Or, in less fancy language, “these metabolites may start or maintain the symptoms of autism”.
But all of this hinges on time. If the metabolites don’t happen before the diagnosis, then all that’s being measured here is some unusual pee. The urine samples were all collected after a diagnosis of autism, which means by definition we have no idea whether this test has any additional diagnostic capacity.
Gender
Food aside, there are other crucial sample-based factors here. Metabolites are impacted by environment — could the autistic kids be poorer, sicker, less likely to do sports, be dehydrated … ? They could.
Of course, you can caveat any early research like this endlessly. (‘How much sun exposure did they get? How many hats do they own?’) An author’s response to the question ‘did you fully account for all the potential covariates and confounds?’ is often ‘that might be a factor, and one day we’ll get around to measuring it if this early work establishes there’s something interesting to look at in the first place”.
That’s often not a good response, but sometimes not a bad one either.
The issue of appropriate control is much harder to ignore under two circumstances:
(a) when we have a good reason to believe a covariate genuinely might make a difference to the experiment, or
(b) the necessary data it is collected but conveniently not analyzed.
Both are true here. Oops.
Feast your eyes on Table 3:
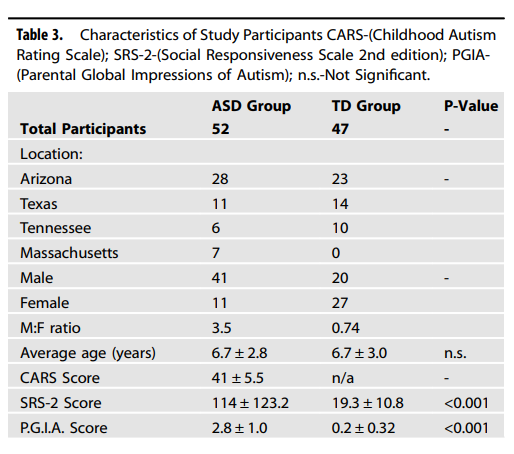
There’s an obvious, massive difference in gender. The ASD group is 79% male; the control group 43%. There’s no p-value for this in the table (and the authors don’t say why…) but a quick chi-squared test gives us a value of 13.75 or a p-value of 0.0002.
Differences in gut microbiota are generally thought to be sex-hormone-dependent — and so reasonably identical in children — but there certainly is literature on the subject of early life and childhood differences in gut microbes (reviewed, albeit briefly, here).
Overfitting
“Total Score is the number of MDMs higher than the concentration of any of the TD children. The ASD group had an average MDM Total Score of 3.3 MDMs, ranging from zero to nine, whereas the TD group all had an MDM Total Score of zero MDMs by definition. Ninety percent of the ASD participants (45 of 50) had one or more extremely elevated MDMs. By setting a cut-off for ASD of one or more extremely elevated MDMs, the MDM test yields a sensitivity of 90% and a specificity of 100%.” (p.5)
This isn’t good.
We have two groups of (presumably, approximately, let’s go with it) log-normal data, and to define an ‘elevated’ level, the ASD group has to have a value higher than all the participants in the other group. Now, if you define the groups like this, it makes no sense whatsoever to report the specificity, because it will always be 100% — no control value can count towards the score, because you defined them out of the ‘score zone’.
Calling this ‘specificity’ in a press release / paper abstract / any other summary content isn’t great, because it ISN’T the test's ability to correctly identify people who do not have a condition. You already knew who those people were and then defined them as too low to participate.
This leads intuitively somewhere rather unpleasant: the fact that if you leave this scoring system intact and start raising the sample size, the system will destroy itself. Doesn’t bode well for doing a larger study.
Let’s break it down quickly:
def run_size_simulation(n_subjects, n_metabolites=24, asd_shift=0.3):

    # ‘asd_shift’ acts as the true biological (or dietary!) difference
    # (e.g. log(1.5) is roughly a 50% shift in the data)

    # let's make a control group (baseline l-normal)
    td_data = np.random.lognormal(mean=0.0, sigma=1.0, size=(n_subjects, n_metabolites))

    # and let's make an ASD group (l-normal, shifted)
    asd_data = np.random.lognormal(mean=asd_shift, sigma=1.0, size=(n_subjects, n_metabolites))

    # now, same rule as the paper: find max control values for groups, call em 'td_max' values
    td_max_thresholds = np.max(td_data, axis=0)

    # how many ASD metabolites cross td_max?
    asd_scores = np.sum(asd_data > td_max_thresholds, axis=1)

    # no point calculating specificity, is there
    # but: sensitivity = percentage of the ASD group with a score of 1 or more
    sensitivity = np.mean(asd_scores >= 1) * 100

    return sensitivity
Now, we have a bare-bones simulation of making some sensitivity scores according to (a) a number of metabolites, and (b) a general shift in the values. Now, let’s spam it with lots of different sample sizes under a log-normal approximation.
import numpy as np
import matplotlib.pyplot as plt

def run_size_simulation(n_subjects, n_metabolites=24, asd_shift=0.3):

    td_data = np.random.lognormal(mean=0.0, sigma=1.0, size=(n_subjects, n_metabolites))
    asd_data = np.random.lognormal(mean=asd_shift, sigma=1.0, size=(n_subjects, n_metabolites))

    # again, max values
    td_max_thresholds = np.max(td_data, axis=0)

    # how many metabolites in the ASD group cross the maximum?
    asd_scores = np.sum(asd_data > td_max_thresholds, axis=1)

    # sensitivity = %age of ASD >= 1
    sensitivity = np.mean(asd_scores >= 1) * 100
    return sensitivity

# let's go from a very thin n=10 to n=47 (this study) up to n=1000, a Phase III-ish size
sample_sizes = [10, 25, 47, 100, 250, 500, 1000]
n_iterations = 1000

# and let's test two scenarios -- no difference at all, and 50% true difference
shift_0 = np.log(1.0)
shift_50 = np.log(1.5)

sens_0 = []
sens_50 = []

print("| Sample Size (n per group) | Sens (0% Diff) | Sens (50% Diff) | Specificity |")
print("| :--- | :--- | :--- | :--- |")

# aaaaaaaaaand simulate
for n in sample_sizes:
    s0_list, s50_list = [], []
    for _ in range(n_iterations):
        s0_list.append(run_size_simulation(n, asd_shift=shift_0))
        s50_list.append(run_size_simulation(n, asd_shift=shift_50))

    avg_s0 = np.mean(s0_list)
    avg_s50 = np.mean(s50_list)

    sens_0.append(avg_s0)
    sens_50.append(avg_s50)

    print(f"| {n} | {avg_s0:.1f}% | {avg_s50:.1f}% | 100.0% |")

# plot
plt.figure(figsize=(10, 6))
plt.plot(sample_sizes, sens_50, label='Sensitivity (50% Real Difference)', color='#d62728', marker='o', linewidth=2)
plt.plot(sample_sizes, sens_0, label='Sensitivity (0% Real Difference)', color='#1f77b4', marker='s', linewidth=2)

# for completeness, the silly Specificity
plt.axhline(y=100, color='#2ca02c', linestyle='-', linewidth=3, label='Specificity (Always 100%)')

# the paper's actual sample size
paper_n = 47
plt.axvline(x=paper_n, color='black', linestyle='--', alpha=0.5, label='Flynn et al. Sample Size (n=47)')

plt.title('Investing "Sample Size Collapse"\n(As sample size increases, sensitivity gets hit)', fontsize=14, pad=20)
plt.xlabel('Number of Subjects per Group (Log Scale)', fontsize=12)
plt.ylabel('Diagnostic Performance (%)', fontsize=12)
plt.xscale('log')
plt.ylim(0, 105)
plt.grid(True, linestyle='--', alpha=0.7)
plt.legend(loc='center right', fontsize=11)

plt.tight_layout()
plt.show()
And… bong.
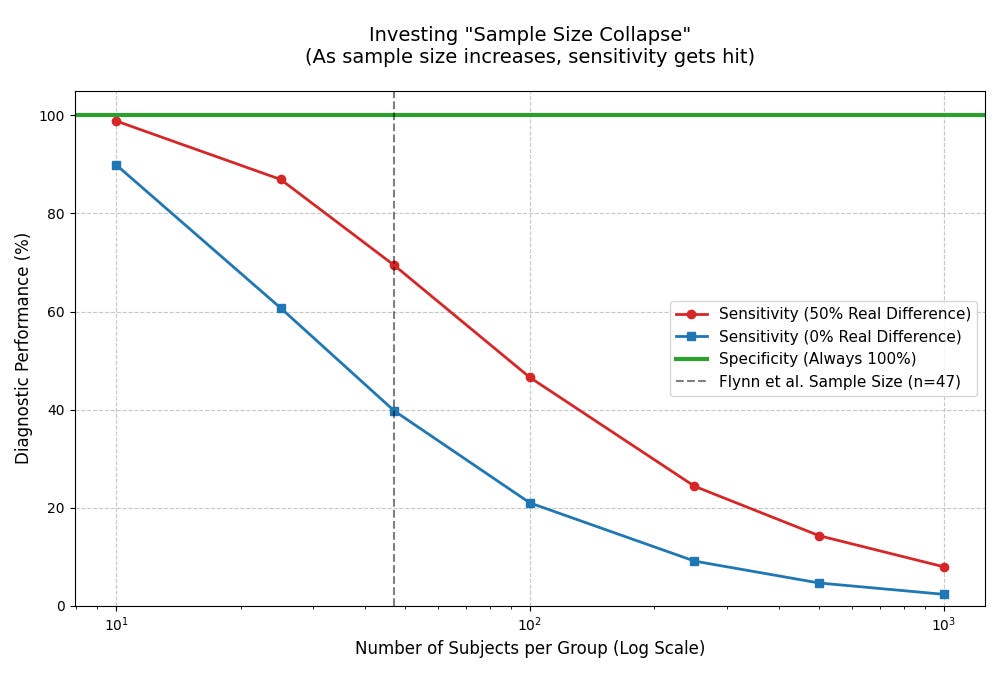
Ergo: if we used the model in place and did this study in a larger sample, its diagnostic capacity would crater by definition. That’s not a stable method of making an observation!
Right, now let’s get to the weird stuff.
The data is very, very confusing
How many things were tested?
The actual number of relevant samples in the paper are also somewhat inconsistent. From the methods:
“Semiquantitative Metabolomics was first conducted by the Translational Research Institute of Genomics (TGEN, USA). The semiquantitative analysis revealed over 600 metabolites that were significantly different between ASD and TDs. Many of the significant metabolites were microbially derived metabolites, with some being previously reported as significant in ASD” (p.3)
Ok, so they tested at least 600 metabolites.
(But, probably more, because they haven’t talked about the total number of metabolites that were tested, just the statistically significant ones out of the thousands found in human urine).
Except, that’s not right.
Here’s Table 2:
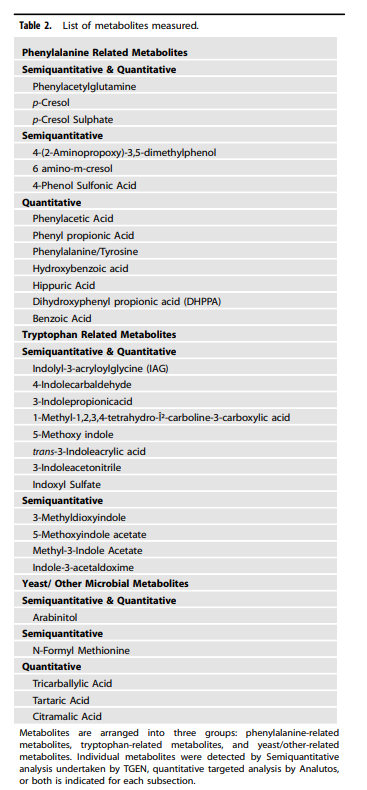
There are 30 metabolites listed there. Where did the other 570 go? The authors don’t say. Then we get to the discussion:
“Twenty-three of 24 microbially derived metabolites were statistically significantly higher in ASD than in TD participants” (p.7)
So now it’s 23/24, rather than 23/30 or even 23/600. Then we look at Table 4 and Table 5, which contain all of the results for the 30 metabolites listed in Table 2. To save you the headache: there are 23 statistically significant differences. But again, out of 30.
Table 5, oddly enough, has 24 metabolites listed. But of those 24 metabolites, only 9 are statistically significantly higher in the ASD group.
False discovery rate
If you throw enough statistical tests at a problem, some of them will be positive purely by chance. The authors calculated a q-value to account for this — that is, an adjusted p-value controlling the false discovery rate. A q-value tells you the expected proportion of false positives among all tests declared significant. (Don’t yell at us, statisticians, we’re tired).
We do not need to get into the statistical weeds on this beyond saying:
q-values, because they are corrected for the false discovery rate, are ALWAYS higher than p-values
q-values are not zero
Buuuuuuuuuuuut:
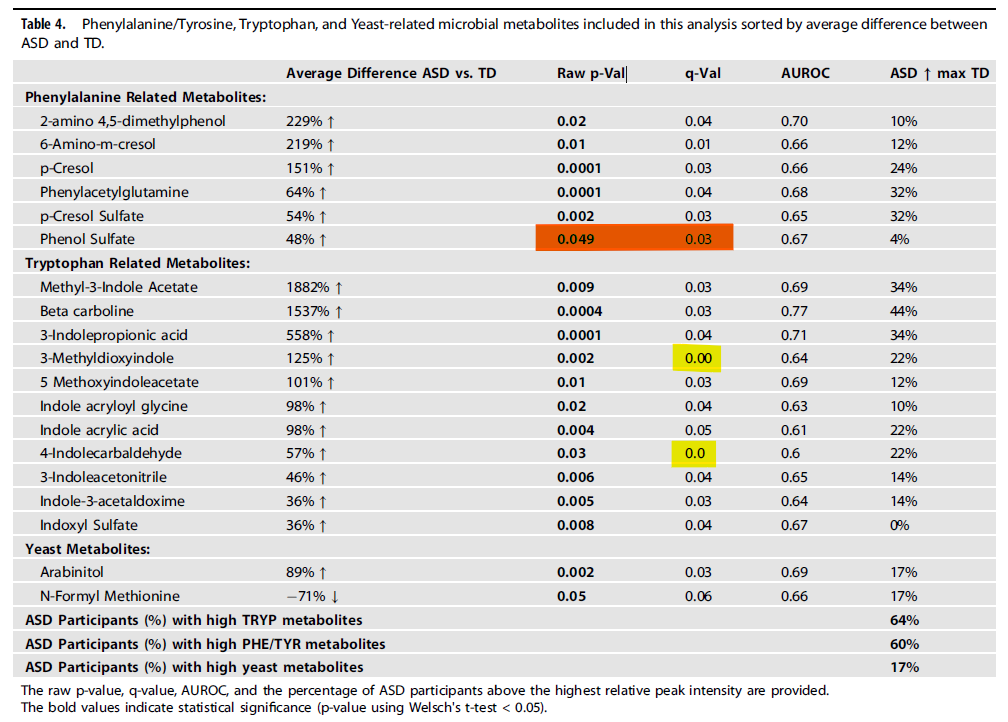
There are three q-values in this table that cannot exist. Below, these are the stars below the line of identity.
The blue data is some hastily assembled random cohorts of multiple observations under similar parameters.
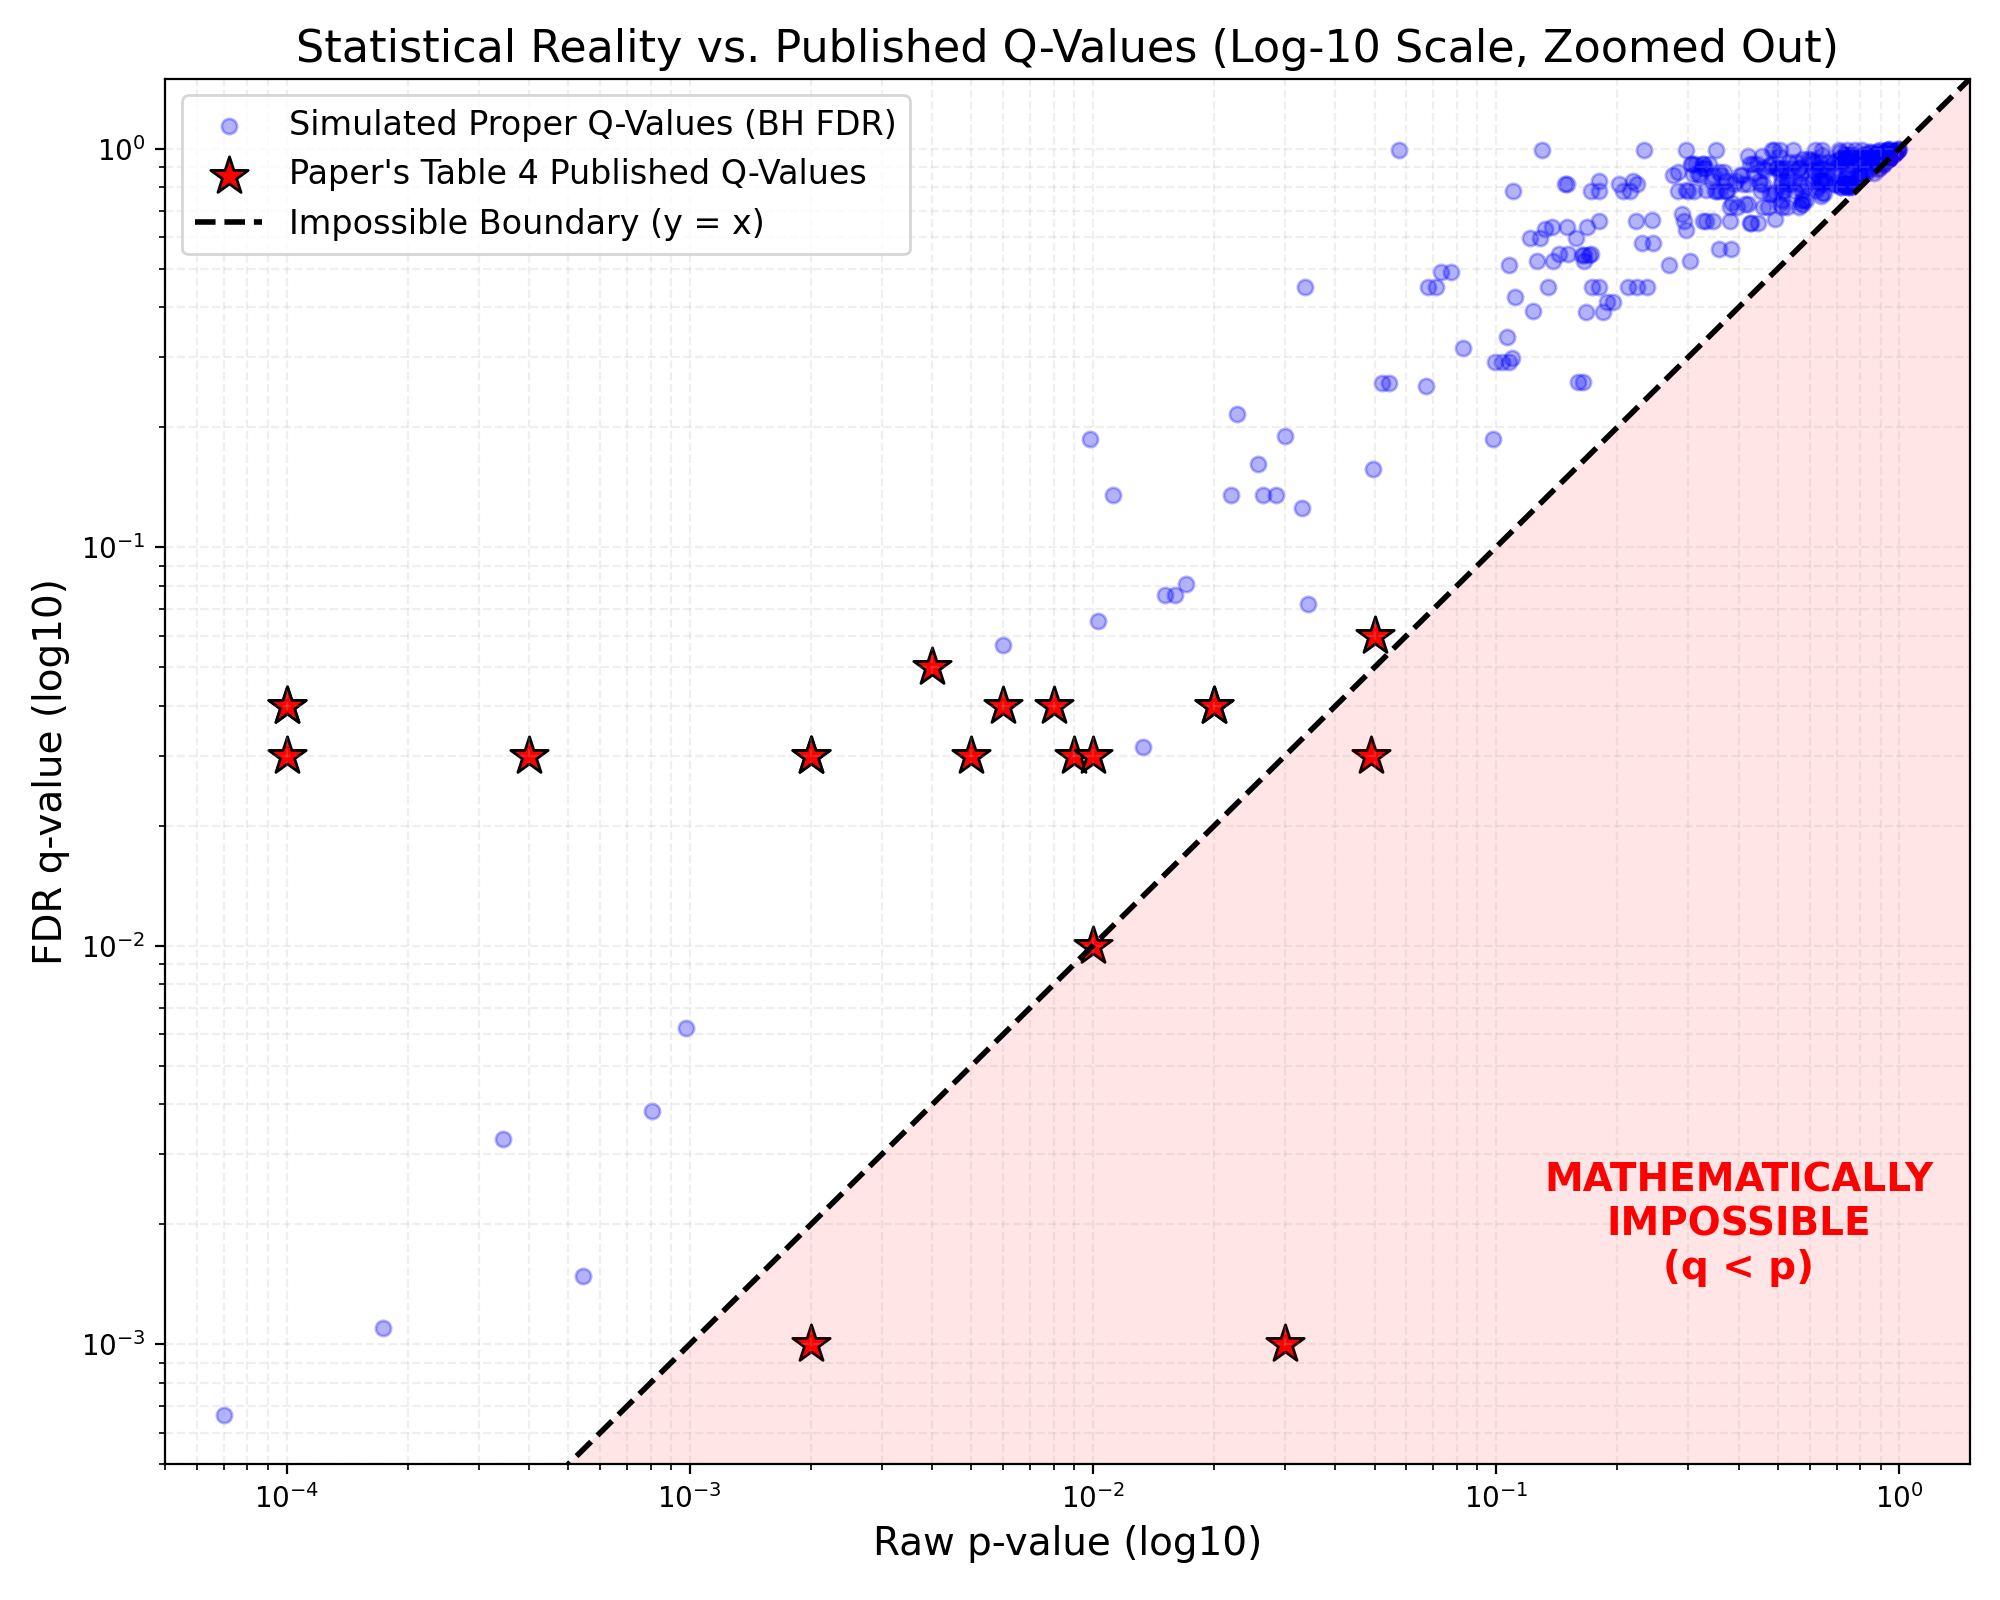
The star at 0.05, 0.03 — this is phenol sulfate. q cannot increase above p.
The star at 0.03, 0.001 (it had to be graphed somewhere, and there’s no 0 on a log scale) — this is 4-indolecarbaldehyde, it cannot be zero.
The star at 0.002, 0.001 (same again) — this is 3-methyldioxyindole, same applies.
This is all so bizarre that all we’re left with is guesses.
The most parsimonious explanation is that:
they calculated q-values correctly from a larger set of metabolites (300? 600?), then
… only showed a curated subset in Table 4, then
… somehow made a series of transcription errors or rounding artifacts (even the zeros are weird! one is 0.00 and the other is 0.0???) that slipped through peer review.
(Note: we don’t know HOW the q-vals were calculated, see if you can find any mention of "Benjamini", "Hochberg", "Storey", "False Discovery Rate", "FDR", "correction", etc. somewhere in either the manuscript or the supplementary material… if you figure it out, please tell us!)
This is absolutely fatal to the coherence of this table, but we’re not even CLOSE to done yet.
Into the data weeds we go
The MDMs included phenylalanine-derived, tryptophan-derived, and yeast-derived MDMs. Almost all children with ASD had one or more MDMs at concentrations above any TD child, and sometimes 100–1000× higher. (abstract)
When you read a sentence like this, it should always narrow your eyes.
‘100x higher’ occupies a mental space where you compare two ‘reasonable’ values.
For instance, we are both about 6ft tall, the Seattle Space Needle is about 600ft tall. The Seattle Space Needle is a lot bigger than us. This is fine and our intuitive understanding of 100x holds.
This is a lot less fine is measurements like …
4-Indolecarbaldehyde
The difference between groups is a 319% increase.
This is flirting dangerously with the limits of detection, and the control numbers are incredibly close to zero. The reported difference for 4-Indolecarbaldehyde is .02 vs .01.
Now, interestingly, this is not mathematically wrong, as 0.01 presumably includes the values from 0.005 to 0.015 to two decimal places, likewise 0.02 is 0.025 to 0.015.
(On that basis, the numbers reported could produce a 0% through 500% difference. The numbers reported, as per usual, are spectacularly uninformative… although that isn’t new or even really problematic, more that obscurantist numbers like this are annoying.)
The problem is a lot simpler: that we are potentially noise-farming. These tiny values flirting with the absolute bare bones of detection range should not responsibly be turned into a percentage and amplified into a “significant” finding. An analogy: if all we have is calipers, ‘a red blood cell is three times thinner than a human hair’ isn’t a useful observation.
While we’re here, something else jumps out…
Tricarballylic Acid
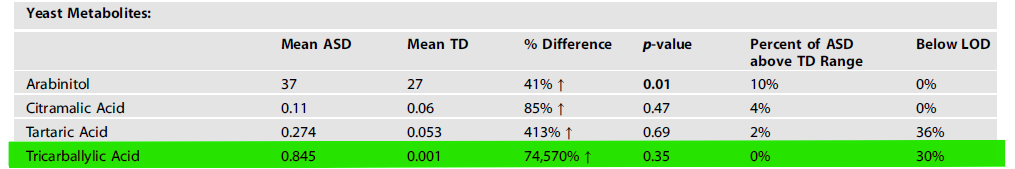
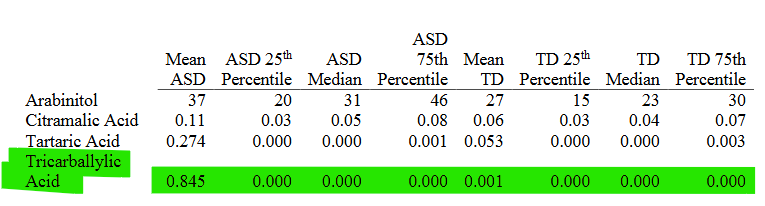
Don’t think about this too long, you’ll get a headache.
30% of the sample is entered as ‘Below LOD’ i.e. zero
But the 75th percentile values are zero.
When you see things like this, your first question should be “Am I reading this right?” But your second question should be “What else is going on here… ?”
We can follow this up with some fairly simple additional reasoning:
We have 47 control kids, and their mean tricarballylic acid level is 0.001.
The highest value possible for any given sample is the mean * sample size (if all the other values are zero!) That particularly strange sample looks like this: [0,0,0,0,0 … , 0, 0.047] — thus, mean = 0.001
The absolute highest possible value for any single control kid is 0.047.
Look in the fourth column of the first picture: “Percent of ASD above TD Range” is 0%. Thus, the tricarballylic acid value of every ASD kid (n=52) is below the 0.047.
But the mean is 0.845.
(And yes, accounting for rounding doesn’t change this meaningfully.)
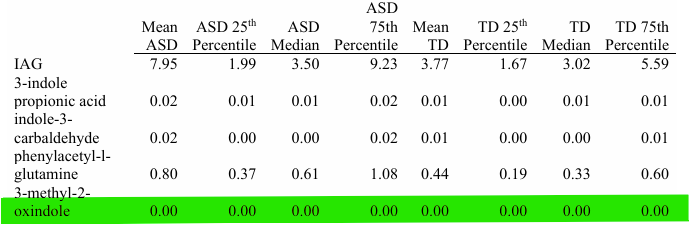
This was quite confusing, likewise was the fact that the chemical names were not identical between the supplementary material and the paper.
S.Table 4 (Supplementary Table 4) reports indole-3-carbaldehyde, in Main Table 5 this becomes 4-Indolecarbaldehyde. S.Table 4 reports on 3-methyl-2-oxindole, which becomes 3-Methyldioxyindole. phenylacetyl-l-glutamine is in “Tryptophan Based Metabolites” section in S.Table 4, but is (correctly) listed in the paper under “Phenylalanine Based Metabolites”.
(Neither of us has a clue what any of that means. It’s just more traditional for names not to change between sources.)
Again, hard to know exactly what happened here, beyond ‘something strange’. Another illustrative example:
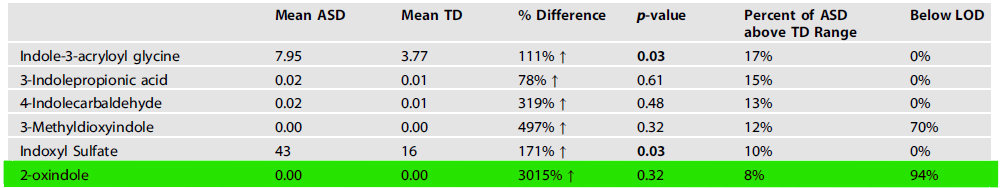
We have 99 children total, and 94% of them are below the LOD (so, zero for them). That’s 93 zeroes and 6 non-zero values. Now, 8% of the ASD kids are above the TD range, so that’s 4. And for a TD range to exist, there must be at least 1 non-zero TD value for 2-oxindole.
So, 4 ASD (high) values, and then (a) 1 ASD (low) value and 1 TD value, or (b) two TD values. And a big bag of zero.
However, none of these values were big enough to influence the mean to not be zero, but there clearly are some real values involved as ASD is 3015% larger than TD.
In short, reporting these metabolites in either the units listed (umol/mmol creatinine) or the decimal places used make this data uninformative.
This is rarely a good sign, either for the authors or for the accuracy of any subsequent analysis. That’s the point where you accept the fact you have to stop, before you get any more confused.
Conclusion
This has been one of the most challenging papers to deploy forensic methods on in living memory. The hard ones are always those where you have large amounts of complex, partial information that doesn’t seem to have any fidelity in its internal structure. Most analysis just results in more questions. One of us (JH) spent several hours trying to hack the unreported properties of some of the tests out into a format that made sense, and eventually renounced science for life at a monastery.
(JH note: it didn’t last).
The eventual summary, if there is one?
The authors tested a massive array of metabolites, picked a few for reasons unknown, and threw out some statistically significant findings.
How these relate to autism is anyone’s guess, and it’s hard to know what the final result actually means. Children with ASD had, on average, 3 microbially-derived metabolites that were higher than any of the kids in the control group. But not the same metabolites, and not consistently. Just 3 of any of the 30 (or 24?) that the authors report as part of their new MDM™ system.
Even if we ignore the giant mess in the results, the opaque methodology, the odd numbers, and the lack of any attempt at causal analysis, there’s really not much there. It’s potentially possible that having a higher score on these metabolites could be associated with autism in a larger sample, but there’s a good chance that these findings are purely down to the children who managed to get picked for this research.
At an absolute minimum, you’d need to look at these metabolites in some children before they got diagnosed with ASD, and ideally before they started displaying symptoms. Even then, there’s every possibility that the entire exercise is just measuring unrelated correlations and has nothing to do with autism per se.
And all this to say nothing of the dinosaur nuggets.
A further note
This kind of paper does not pass through a membrane from an alternative reality, it feeds directly into an unregulated, multi-million-dollar “biomedical” autism industry.
When parents receive an autism diagnosis, they are often overwhelmed. And scared. All the ‘messaging’ in the world will never make this response go away.
Papers like this are routinely intercepted by a large and usually unregulated ‘wellness’ industry that treats these scared parents as a source of value. This is where we get concepts like “yeast overgrowth,” and “leaky gut,” and “bacterial dysbiosis.” By framing common neurodivergence as a toxicity, these concepts create an intense urgency for parents to “detoxify” their child.
And, regardless of the intentions of the authors, the backing of Real Actual Adult Science From A Good Peer-Reviewed Journal is a decent rhetorical weapon to get a parent to pay hundreds of dollars out-of-pocket for a test.
And while we’re here…
Nature group journals do not publish their peer review reports. That’s a real shame, because it would be fascinating to see what was going on under the hood on this one, because Molecular Psychiatry really crashed this one into a ditch.
While this is a specialized review, and it would be high-handed and unrealistic to expect a regular peer review report to look like this document, there are several data and methodology features here which really truly should have been caught in regular peer review.
Part of being a Fancy Journal that offers a Fancy Service is that you serve as a counterweight to the author’s eagerness to promote their results. When you publish papers with this many obvious problems and this kind of external risk, you do your job poorly.
Do it better.

 | A guest post by
|