
Many Coauthors - Some Rolling Notes

For those of you with only a passing interest in research integrity, here’s the last six months of fiddle-faddle:
https://www.theguardian.com/education/2023/jun/25/harvard-professor-data-fraud
https://www.newyorker.com/magazine/2023/10/09/they-studied-dishonesty-was-their-work-a-lie
https://www.thecrimson.com/article/2023/10/13/gino-hbs-motion-dismiss/
https://www.chronicle.com/article/scientists-are-scrutinizing-their-work-with-francesca-gino-heres-what-theyve-found-so-far ← most important
A summary from that article:
More than 140 collaborators of Francesca Gino, the Harvard Business School professor who has been accused of data fabrication, have been scrambling to verify the research that they’ve published with her. On Monday, they started making their findings public.
The mass self-auditing effort, called the Many Co-Authors Project, has already initiated the retraction of at least one paper that Gino collected data for, according to one of her collaborators.
As of Monday, the database listed 56 papers in which Gino was named as being involved with collecting data for at least some of the experiments.
As these datasets come to light, and more is known about the individual papers and their data provenance, people will notice or analyze various features of them. One of those people will be me. I will aggregate the information here.
ManyCoauthors #129
Gino, Gu, and Zhong (2009)
“Contagion or restitution? When bad apples can motivate ethical behavior.”
This paper is annoying. Not because it’s a social science paper, although that doesn’t help. Rather, two things.
(1) Because we have this description of it from Gu and Zhong:
As I remember it, the second author (Gu) and I were provided with fully written Results sections for all three experiments, emailed to us by the first author (Gino). Neither of us had access to the raw data that the first author used to generate these write-ups.
This is maximally suspicious (in ANY context, from ANY author, this would be odd… academic co-authors generally communicate in data, by bouncing numbers and their analyses back and forth like nerd footballs) but minimally helpful.
Also, because:
(2) Because it has a money task that was conducted in half-dollars and quarters.
The experimenter then gave each participant an envelope with $10 (eighteen 50¢ coins and four quarters). The experimenter asked the participants to take the amount of money they wanted to keep out of the envelope and leave the rest in the envelope to be sent to their ostensible counterpart in the other room.
I’ve been in America for nearly a decade (more fool me) and I’ve never even seen a half dollar. I thought they were only for weirdos and numismatists. But, I suppose they give you a little more precision if you’re making undergraduates do a financial experiment, likewise the handful of quarters.
Anyway, let’s say they’re real, and some poor bank teller had to go scratching around the back of the vault behind the bins to find them. This unfortunately ruins our ability to assess the accuracy of the methods via GRIM or related techniques. That’s the center of the annoying bit.
Rather than whole numbers, we have to analyze in ‘quarter-dollars’, and this means all of the presented data in Experiment 1 is possible.
The magnitude of the effects discovered are eye-opening, especially the giant clean interaction effect, but that’s… well, that’s just Tuesday in 2009-era JESP papers.
However, there is some sentiment data reported in Experiment 3, which seems to be reported in whole units.
They also indicated how guilty they would feel about the behavior of the person who took all the money along with some unrelated emotional measures (1 = not at all, 5 = very much)… participants in the in-group selfish condition felt more guilty (M = 4.61, SD = 1.64) about the person’s selfish behavior than the participants in the out-group selfish condition (M = 3.26, SD = 1.54), t(80) = 3.82, p < .001.
If you have a 1 to 5 scale, it isn’t possible to have M = 4.61, SD = 1.64. It doesn’t matter what the cell size is (and, of course, that is unreported) although it seems likely it’s n=41 (as 189/41 = 4.6098).
We met the 'Umbrella graph’ some years ago, which is a basic visualization of the areas that are possible for any mean/SD pair. The top curved piece is formed by min/max values added together to make the biggest possible mean/SD pairs (i.e. 1,1,1, 5, 5, 5, 5, 5, etc.) and the bottom scalloped edge the smallest, made from only consecutive numbers (i.e. 3, 3, 3, 3, 4, 4, 4, 4, 4, etc.)
Here’s the umbrella graph of M = 4.61, SD = 1.64, range = 1-5, in whole units.
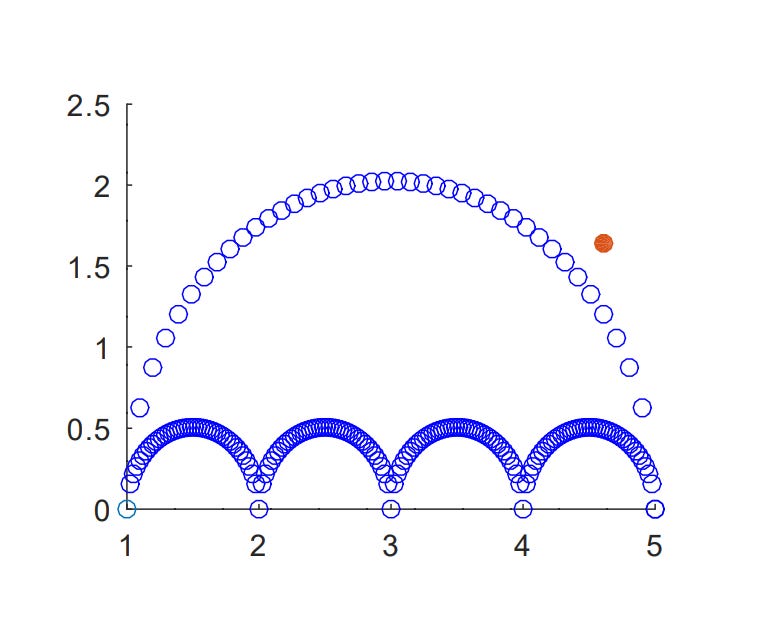
(should have labelled it, but it should be obvious that we’re x-axis = mean, y-axis = SD)
To put it another way, if we lower the SD to just1.2, the histogram looks like this:

Goofy.
Now, it could be a typo. If that’s the case, the statistics will show something different.
But they don’t. “M = 4.61, SD = 1.64 vs M = 3.26, SD = 1.54), t(80) = 3.82, p < .001” is correct - I get t = 3.8424 but that’s definitely close enough for decimal tails to account for the difference, and the fuzz in the absent sample sizes.
The other figure (M = 3.26, SD = 1.54) is possible at, at a minimum, n=38 and n=43. We could do a better job of establishing the cell sizes, but it still wouldn’t change the impossibility of the point above.
(Note: it’s just one number, don’t get all excited. But it is a very weird number.)
ManyCoauthors #29
Lee, JJ; Hardin, AE; Parmar, B; Gino, F (2019)
'The Interpersonal Costs Of Dishonesty: How Dishonest Behavior Reduces Individuals' Ability To Read Others' Emotions'
Fully expurgated on Nick Brown’s blog here. Go read it.
Short version: 37 participants were excluded for inattention. These excluded participants, analysed by themselves, show a very strong negative effect (t = -4.1645, df = 35, p-value = 0.0001935), in the opposite direction to the main study result.
Analysing the full sample, including the excluded points, kills the main effect completely (t = 0.20148, df = 246, p-value = 0.8405).
TBC